Negotiation
3 1 2
Roll up to Redvers
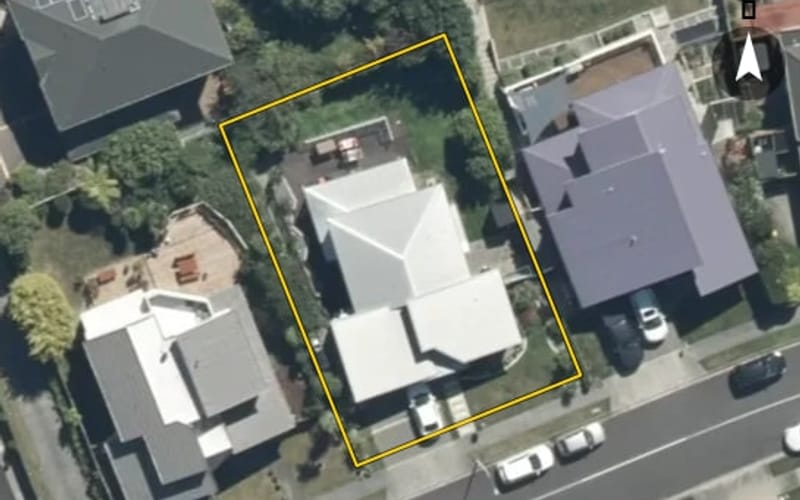
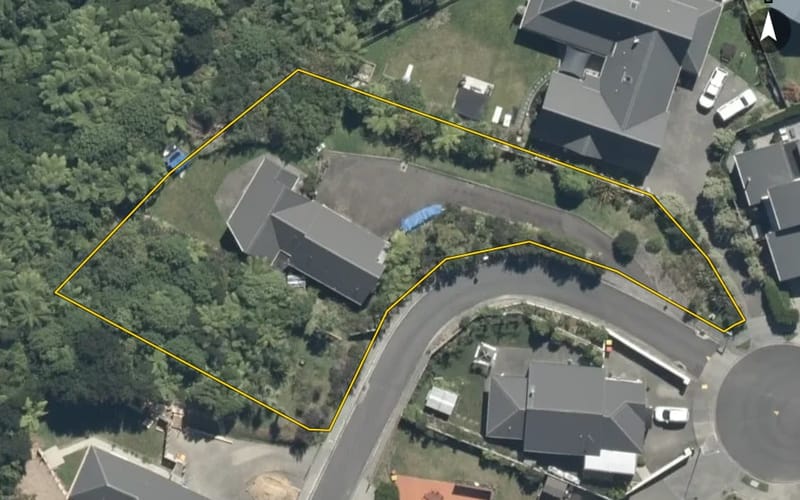
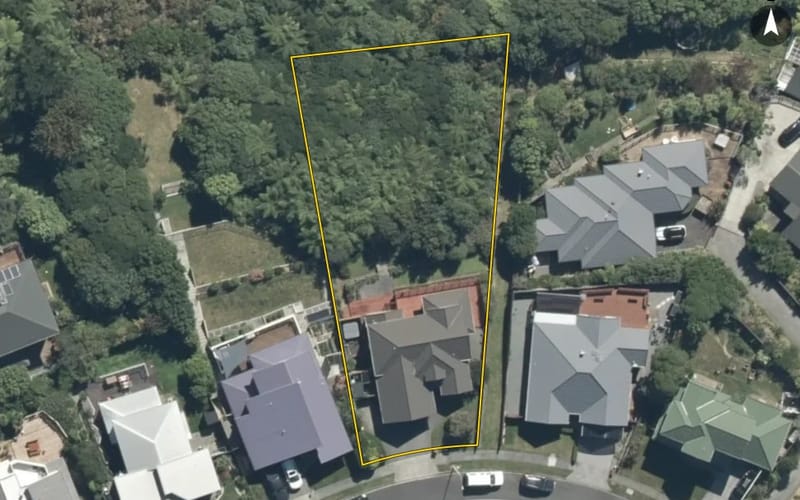
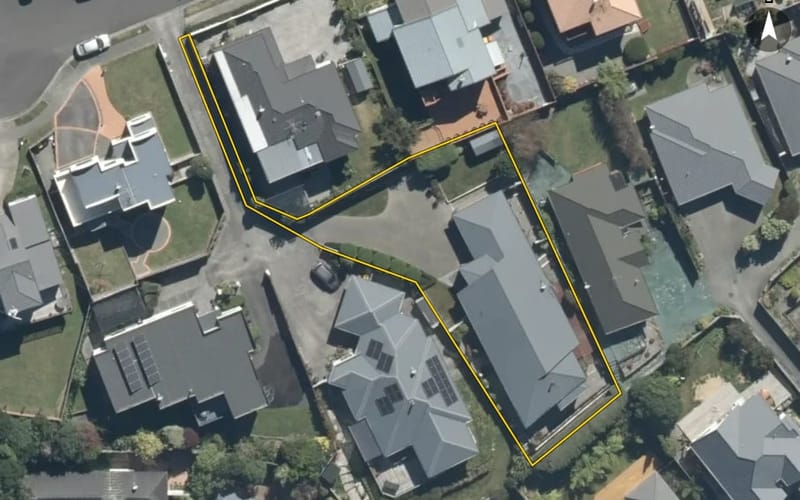
3 Redvers Drive, Belmont
Bayleys Upper Hutt

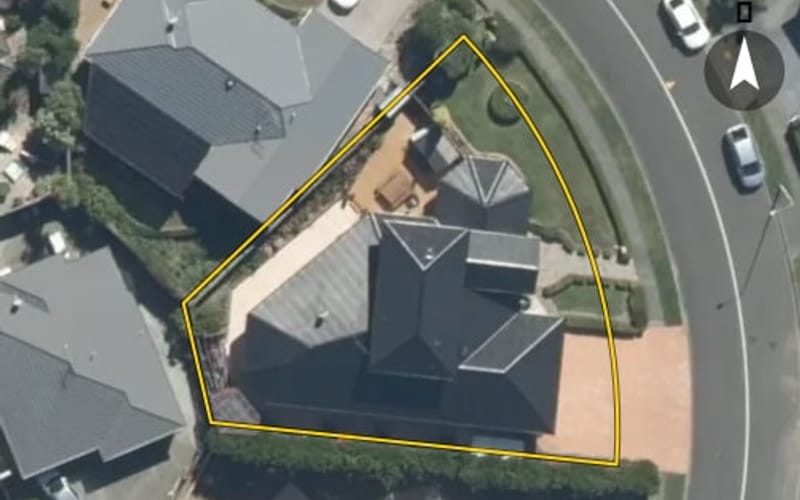
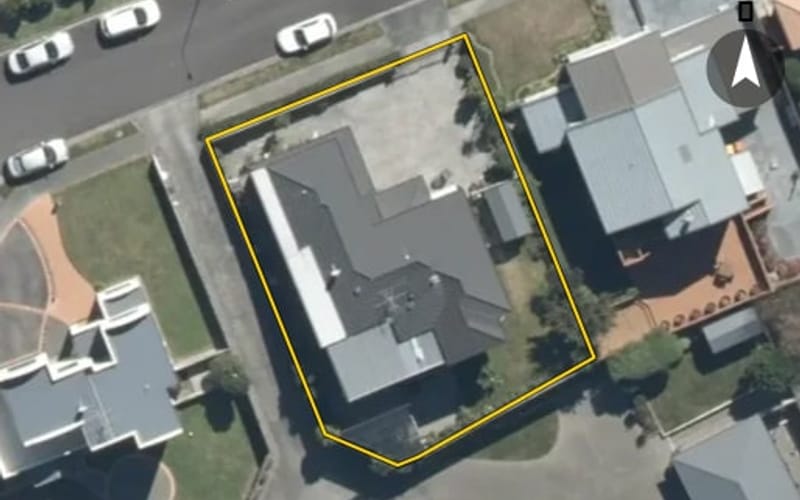
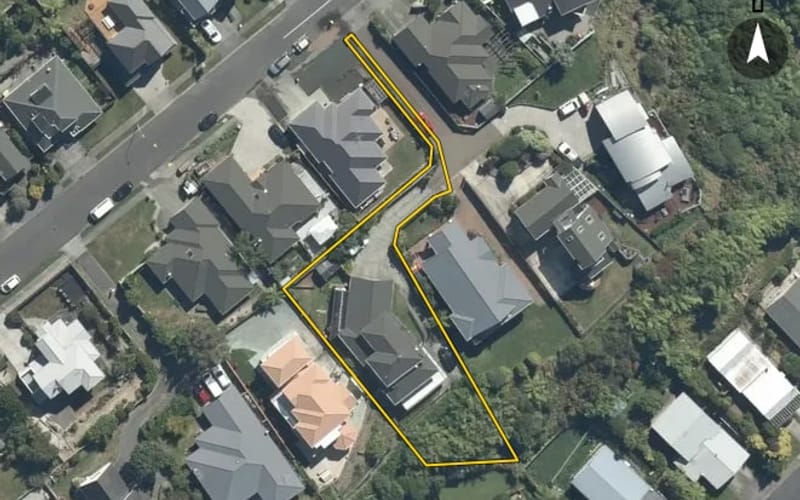
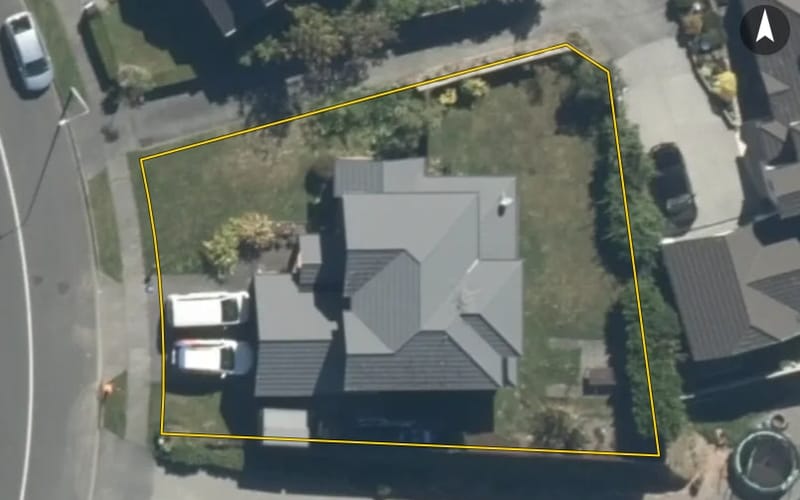
Redvers Drive in Belmont has 143 properties, valued by the council between $190,000 and $1,350,000 with a median of $880,000 (Belmont: $840,000). More of its homes were built in the 2000s than in any other decade. We estimate its homes at a median $860,500. 4 sold in the last twelve months, for a median $807,500. The highest sale in 2026 was 53 Redvers Drive, at $975,000. 3 are for sale now.


The council values Redvers Drive's 141 rated properties between $190,000 and $1,350,000. The middle half sit between about $770,000 and $985,000; the median is $880,000 and the mean $878,298.
| Bedrooms | Homes | Median council value | Sold, last 12 months | Median sale |
|---|---|---|---|---|
| 2 | 1 | $610k | 0 | — |
| 3 | 51 | $770k | 3 | $800k |
| 4 | 75 | $940k | 1 | — |
| 5+ | 12 | $1.03m | 0 | — |
Council rating valuations: the council's figure for apportioning rates, not a market appraisal.
Redvers Drive's median council value is 5% above Belmont's.
| Redvers Drive | Belmont | Lower Hutt | |
|---|---|---|---|
| Median council value | $880k | $840k | $790k |
| Median sale, last 12 months | $808k | $851k | $790k |
| Sold in the last 12 months | 2.8% | 3.2% | 1.5% |
| Time between sales | 12.2 yrs | 10.5 yrs | 9.7 yrs |
| Median section | 586 m² | 921 m² | 579 m² |
| Median year built | 1990 | 1970 | 1960 |
| Council value per m² of floor | $5k | $5k | $6k |
Median sale price by year; 2026 is the year so far. A year with fewer than two sales has no bar.
| Year | Sales | Median price | Per m² floor |
|---|---|---|---|
| 2026 | 3 | $815,000 | $4,432 |
| 2025 | 7 | $945,867 | $5,251 |
| 2024 | 5 | $770,000 | $4,450 |
| 2023 | 4 | $908,333 | $5,386 |
| 2022 | 7 | $990,000 | $5,251 |
| 2021 | 7 | $990,000 | $5,958 |
| 2020 | 7 | $845,000 | $4,835 |
| 2019 | 4 | $844,750 | $4,047 |
| 2018 | 9 | $705,000 | $3,939 |
| 2017 | 8 | $670,000 | $3,191 |
| 2016 | 13 | $550,000 | $3,225 |
Redvers Drive has 132 houses, 9 units and townhouses and 2 sections. More were built in the 2000s than in any other decade (41%).
Homes on Redvers Drive that resold in the last five years had been held a median 12.2 years (Belmont: 10.5 years).
Time between a home's sales, for 30 resales in the last five years. A home not sold since our records begin is not counted, so owners who stay longest are under-represented.
Every street in Belmont, and the suburb's house prices and sales.
Sales and valuations as at 11 September 2026, from council and LINZ records. Medians resting on fewer than 3 sales are not shown.
The real estate agents credited on Redvers Drive sales since 2016, most first. Selling here? These are the agents who have sold your neighbours' homes. A count of sales, not a rating. Every agent who sold in Belmont.
 Shane BrockelbankProfessionals Redcoats
 Diane CummingsCummings Kilgariff & Co Realty
 Hannah KilgariffCummings Kilgariff & Co Realty
 Shellene EksteenProfessionals Redcoats
 Luke JohnsonProfessionals Redcoats Wainuiomata
75 sales on Redvers Drive since 2016; 32 of them name an agent we can show, and the counts here are taken from those.
Every property in Redvers Drive, Belmont, whether it is for sale or not: homes, sections, farms, lifestyle blocks, shops, offices and industrial land. Each is listed from the council rating roll and Toitū Te Whenua LINZ, with the listing beside it when an agent is marketing it.
Each property has its own page: our estimate of its value beside the council rating valuation, past sale prices, the title and land area, zoning and hazards, building consents, and what it would cost to own.
Listings are published by the agents who market them. Addresses, land details and rating valuations come from Toitū Te Whenua Land Information New Zealand and from the council. No ownership information is published.
Header photo: Greater Wellington Regional Council, CC BY 4.0, via Wikimedia Commons (licence).