Negotiation
4 3 3
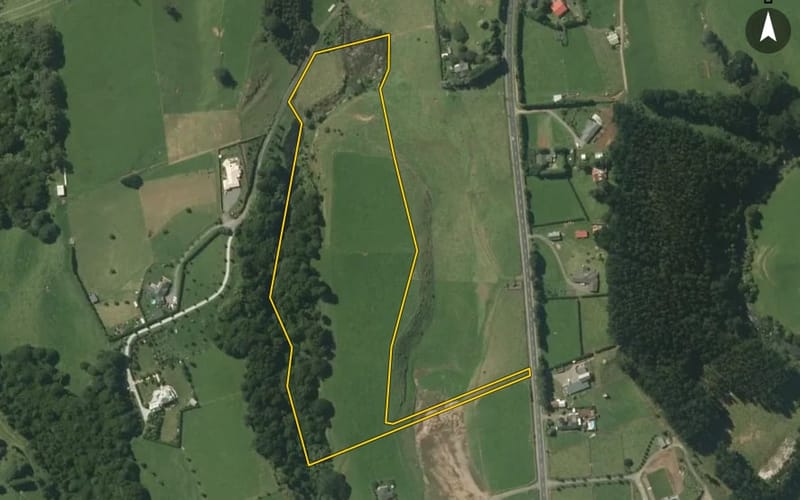
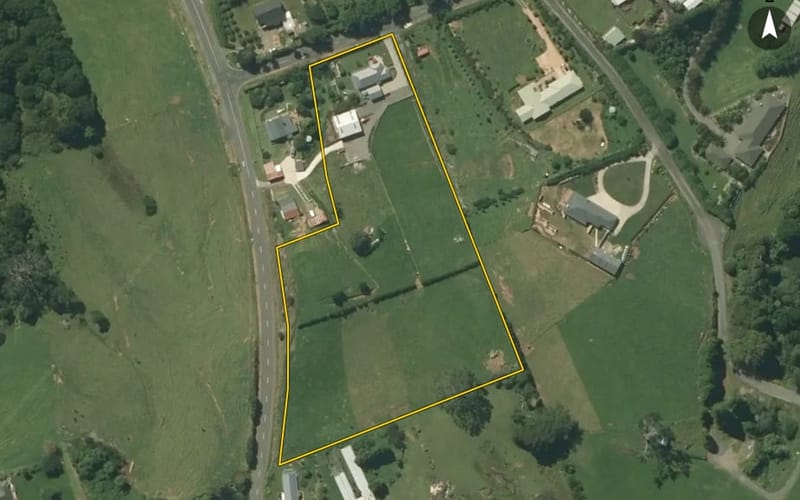
A Unique Private Lifestyle Retreat
65 Parrs Road, Hurworth
Harcourts New Plymouth

Hurworth's median sale price over the last twelve months was $1.1m, across 23 sales, down 11% on the twelve months before.


Homes sold for a median $4,617 per square metre of floor over the last twelve months. Homes in Hurworth change hands every 7.2 years on median, against 8.3 across New Plymouth and 7.9 nationally. About 4% of its homes sold in the last twelve months.
Median sale price by year, all homes; 2026 is the year so far. Hurworth's median sale price over the last twelve months was $1.1m, across 23 sales, down 11% on the twelve months before. Across New Plymouth it was $709k.
| Year | Sales | Median price | Per m² floor | Per m² land (est.) | New Plymouth median |
|---|---|---|---|---|---|
| 2026 | 13 | $1,155,000 | $4,761 | $125 | $710,000 |
| 2025 | 27 | $1,090,000 | $5,048 | $113 | $700,000 |
| 2024 | 26 | $1,090,000 | $5,075 | $116 | $710,000 |
| 2023 | 18 | $1,142,500 | $5,111 | $262 | $690,000 |
| 2022 | 24 | $1,030,000 | $5,450 | $193 | $725,000 |
| 2021 | 31 | $900,000 | $4,140 | $188 | $670,000 |
| 2020 | 56 | $327,500 | $2,023 | $100 | $510,000 |
| 2019 | 27 | $710,000 | $3,413 | $105 | $445,000 |
| 2018 | 42 | $463,000 | $2,321 | $103 | $432,250 |
| 2017 | 47 | $415,000 | $2,205 | $78 | $407,000 |
| 2016 | 31 | $605,000 | $2,489 | $47 | $377,000 |
Our model's median estimate for homes in Hurworth, down 3% over the last twelve months. An automated estimate, not a registered valuation.
| Bedrooms | Homes | Median council value | Sold, last 12 months | Median sale | Per m² floor |
|---|---|---|---|---|---|
| 2 | 7 | $1.05m | 0 | — | $6,731 |
| 3 | 97 | $900k | 2 | — | $5,688 |
| 4 | 263 | $1.12m | 12 | $1.18m | $4,853 |
| 5+ | 62 | $1.56m | 2 | — | $4,355 |
Homes in Hurworth sold for a median $4,617 per square metre of floor over the last twelve months, land included (New Plymouth: $4,826); the land under houses sold for an estimated $123 per square metre (New Plymouth: $524). A sale price is not split between land and house, so the land figure gives the land the council's share of each sale — the land value as a part of the capital value at the last revaluation.
Homes in Hurworth change hands every 7.2 years on median, against 8.3 across New Plymouth and 7.9 nationally.
By kind: houses 6.9 years.
Time between a home's sales, for homes that resold in the last five years. A home not sold since our records begin is not counted, so owners who stay longest are under-represented.
About 1,911 people lived in Hurworth at the 2023 census (up 28% since 2018); their median age was about 48 (New Plymouth: 42); 87% of households owned their home (New Plymouth: 72%).
Stats NZ Census 2023 and 2018, summed over the census areas inside Hurworth. Medians are approximate: Stats NZ publishes them per area and they cannot be added up exactly.
26 agents have been credited on a sale or a live listing in Hurworth in the last two years. Those with the most:
All 26 real estate agents in Hurworth, with their recent sales and which agencies sell the suburb.
Counted from sales records that name the agent, and from current listings. A count of activity, not a rating.
Search building consents in Hurworth and see Stats NZ's count of new homes there.
Sales and valuations as at 18 September 2026, from council and LINZ records. Figures resting on fewer than 5 sales are not shown.
Every property in Hurworth, New Plymouth, whether it is for sale or not: homes, sections, farms, lifestyle blocks, shops, offices and industrial land. Each is listed from the council rating roll and Toitū Te Whenua LINZ, with the listing beside it when an agent is marketing it.
Each property has its own page: our estimate of its value beside the council rating valuation, past sale prices, the title and land area, zoning and hazards, building consents, and what it would cost to own.
Listings are published by the agents who market them. Addresses, land details and rating valuations come from Toitū Te Whenua Land Information New Zealand and from the council. No ownership information is published.
Header photo: Simon Infanger on Unsplash (licence).